The Phylophenome: A Temporal Map of Human Disease
ClaiD maps which conditions tend to follow which, and over what interval, across 300,000 patient records
Created Oct 30, 2026 - Last updated: Oct 30, 2026
The human genome gave medicine a reference map of DNA. Clinical medicine still lacks an equivalent reference for the order in which diseases follow one another, even though electronic health records document these sequences for millions of patients. We built the Phylophenome to supply that map, and we have released ClaiD (pronounced “clade”), a public web explorer for it, at clai-group.github.io/claid-infrastructure.
The name borrows from phylogenetics, in which ancestors give rise to descendants. In the Phylophenome, a baseline health state gives rise to the diagnoses and complications that follow it. Each directed edge links an earlier phenotype to a later one and places the transition in a time window of 0 to 14, 15 to 30, 30 to 90, or more than 90 days.
How we built the map
We derived the first instantiation from the longitudinal electronic health records of about 300,000 patients at Mass General Brigham. Each edge carries three separate lines of evidence, so a user can judge a pathway by more than one kind of support.
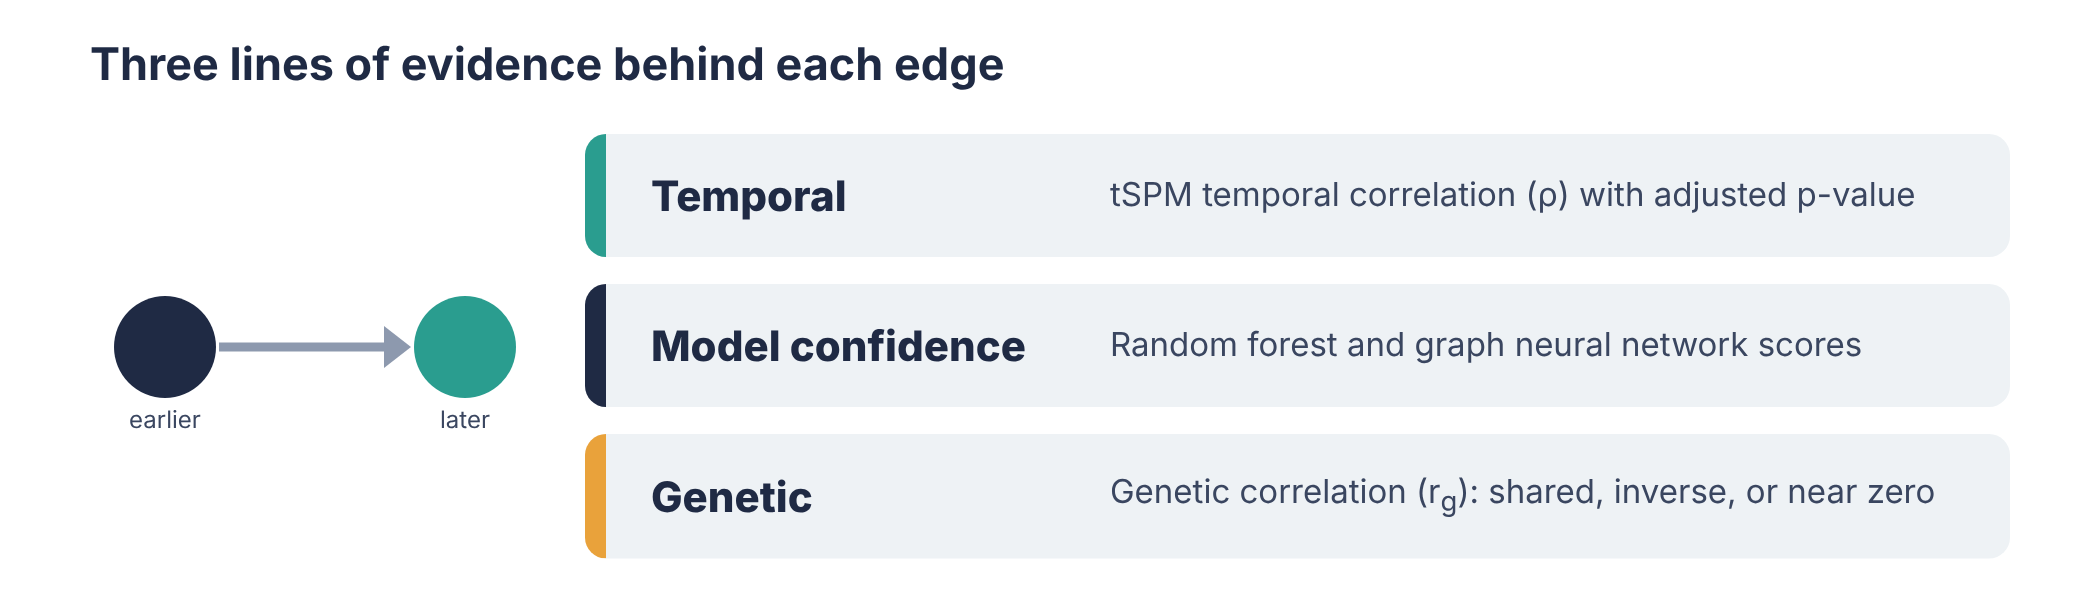
The first line of evidence is temporal: transitive sequential pattern mining (tSPM), our method for extracting ordered pairs of diagnoses from patient records, estimates the temporal correlation (ρ) between two conditions and its adjusted p-value. A random forest and a graph neural network supply the second line, each scoring its confidence in the edge. For the third, a genetic layer reports the genetic correlation (rg) between the two conditions and flags whether their genetic architecture is shared, inverse, or near zero.
Exploring pathways in ClaiD
A user selects a body system, a condition, and a direction, and ClaiD plots the conditions that tend to precede or follow it, with time gap on the horizontal axis and model confidence on the vertical axis. Filters set a threshold for each evidence layer and combine the two model scores with AND or OR logic. The progression builder chains individual steps into multistep pathways, which users can export as CSV files. Gaps of 0 to 14 days are labeled as co-occurrence, which keeps concurrent diagnoses apart from true progression. A calibration trace tests, across the full corpus, whether higher model confidence corresponds to stronger genetic support.
Seven worked pathways
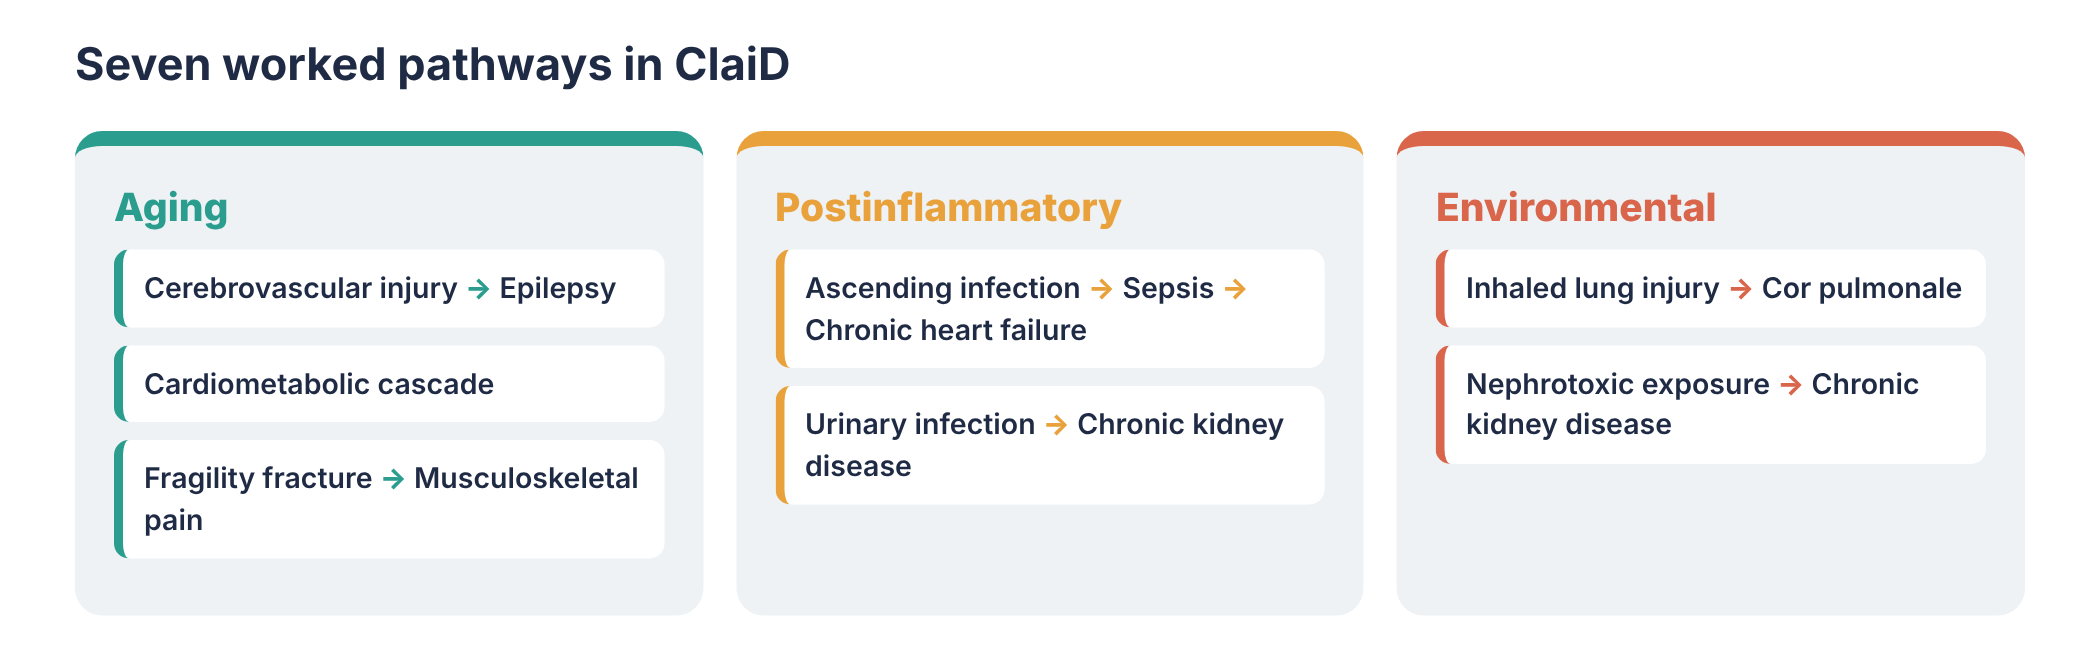
The site walks through seven vignettes in three families. Three aging pathways run from cerebrovascular injury to epilepsy, through a cardiometabolic cascade, and from fragility fracture to musculoskeletal pain. Two postinflammatory pathways follow ascending infection through sepsis to chronic heart failure and urinary infection to chronic kidney disease. The environmental family traces inhaled lung injury to cor pulmonale and nephrotoxic exposure to chronic kidney disease. Several of the aging pathways carry genetic support, whereas the infection and environmental pathways show no genetic signal, a pattern consistent with a cause that originates outside the genome.
Intended uses
The Phylophenome generates hypotheses about timing and sequence. Its edges describe associations with an interval attached, and any causal claim about a pathway requires a design built for causal inference. Three uses follow directly: choosing outcomes and follow-up windows for cohort studies, ranking the downstream conditions that warrant screening after an index diagnosis, and supplying temporal structure to the knowledge graphs that ground clinical AI. The current release reflects one health system in New England, and we will extend the map to additional populations and data sources.
Explore the map at clai-group.github.io/claid-infrastructure. Jiazi Tian (jtian@mgh.harvard.edu) leads development and welcomes questions about the tool.